Planer

  • Home
  • Chapters
    • 01: Introduction
    • 02: Visual Ethics
    • 03: Research
    • 04: Design
    • 05: Visualization
    • 06: Maps
    • 07: Diagrams
    • 08: Motion
    • 09: Case Studies
  • Examples
    • Maps
    • Charts
    • Diagrams
    • Data Visualization
    • Interactive Graphics
    • Motion Graphics
  • Resources & Exercises
  • Expert Interviews
  • Tutorials
    • Illustration
    • Motion graphics
    • Data visualization
    • GIS
    • JavaScript
Home 2016 March 16 Assessing graphics potential

Assessing graphics potential

Screen Shot 2016-03-16 at 6.35.21 PM

The ability to spot graphics potential in a story is one of the most important skills a graphics reporter can possess. Furthermore, conversations about whether a story warrants graphic support should occur as a story is developing, not after it’s complete. Of course, deadlines, breaking news, or even simple breakdowns in communication may prevent a graphics reporter from getting in on early planning and development stages. So, graphics reporters should be prepared to assess graphics potential on two levels: (1) early in the story development process, before a story is written, and (2) after the story is finished and ready for publication. The first scenario requires that you be on your toes, aware of the stories that are developing, and ready to contribute to the storytelling process. Don’t expect writers or editors to alert you about stories that may need graphic support. Be proactive!

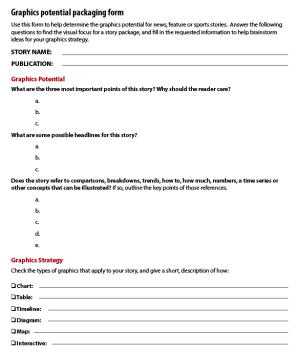
Download and use this Graphics Potential Packaging Form to guide you through the process of assessing graphics potential for your stories.

Mar 16, 2016 jennpal
Hello world!Streamline Water Motion Graphic
Recent Posts
  • Interactive Map: Sierra Nevadas
  • Data Visualization: Plotting Emotion
  • Information Graphic: What Time Will the Polls Close?
  • Data Visualization: The Complete History Of The NFL
  • Aortic Stenosis
Recent Comments
  • Mr WordPress on Hello world!
Archives
  • April 2017
  • January 2017
  • November 2016
  • October 2016
  • September 2016
  • March 2016
  • May 2015
Categories
  • Charts
  • Data visualization
  • Data Visualization
  • Diagrams
  • Examples
  • Exercises & Resources
  • Expert Interviews
  • Featured
  • GIS
  • Illustration
  • Interactive Graphics
  • JavaScript
  • Maps
  • Motion Graphics
  • Motion graphics
  • Tutorials
  • Uncategorized
Meta
  • Log in
  • Entries feed
  • Comments feed
  • WordPress.org
Footer Sidebar 1

Drop a widget on "Footer Sidebar 1" sidebar at Appearance > Widgets page.

Footer Sidebar 2

Drop a widget on "Footer Sidebar 2" sidebar at Appearance > Widgets page.

Footer Sidebar 3

Drop a widget on "Footer Sidebar 3" sidebar at Appearance > Widgets page.

2016
Planer theme by Dankov