Planer

  • Home
  • Chapters
    • 01: Introduction
    • 02: Visual Ethics
    • 03: Research
    • 04: Design
    • 05: Visualization
    • 06: Maps
    • 07: Diagrams
    • 08: Motion
    • 09: Case Studies
  • Examples
    • Maps
    • Charts
    • Diagrams
    • Data Visualization
    • Interactive Graphics
    • Motion Graphics
  • Resources & Exercises
  • Expert Interviews
  • Tutorials
    • Illustration
    • Motion graphics
    • Data visualization
    • GIS
    • JavaScript
Home 2016 October 31 Data Visualization: The Complete History Of The NFL

Data Visualization: The Complete History Of The NFL

screen-shot-2016-10-31-at-1-28-30-pm

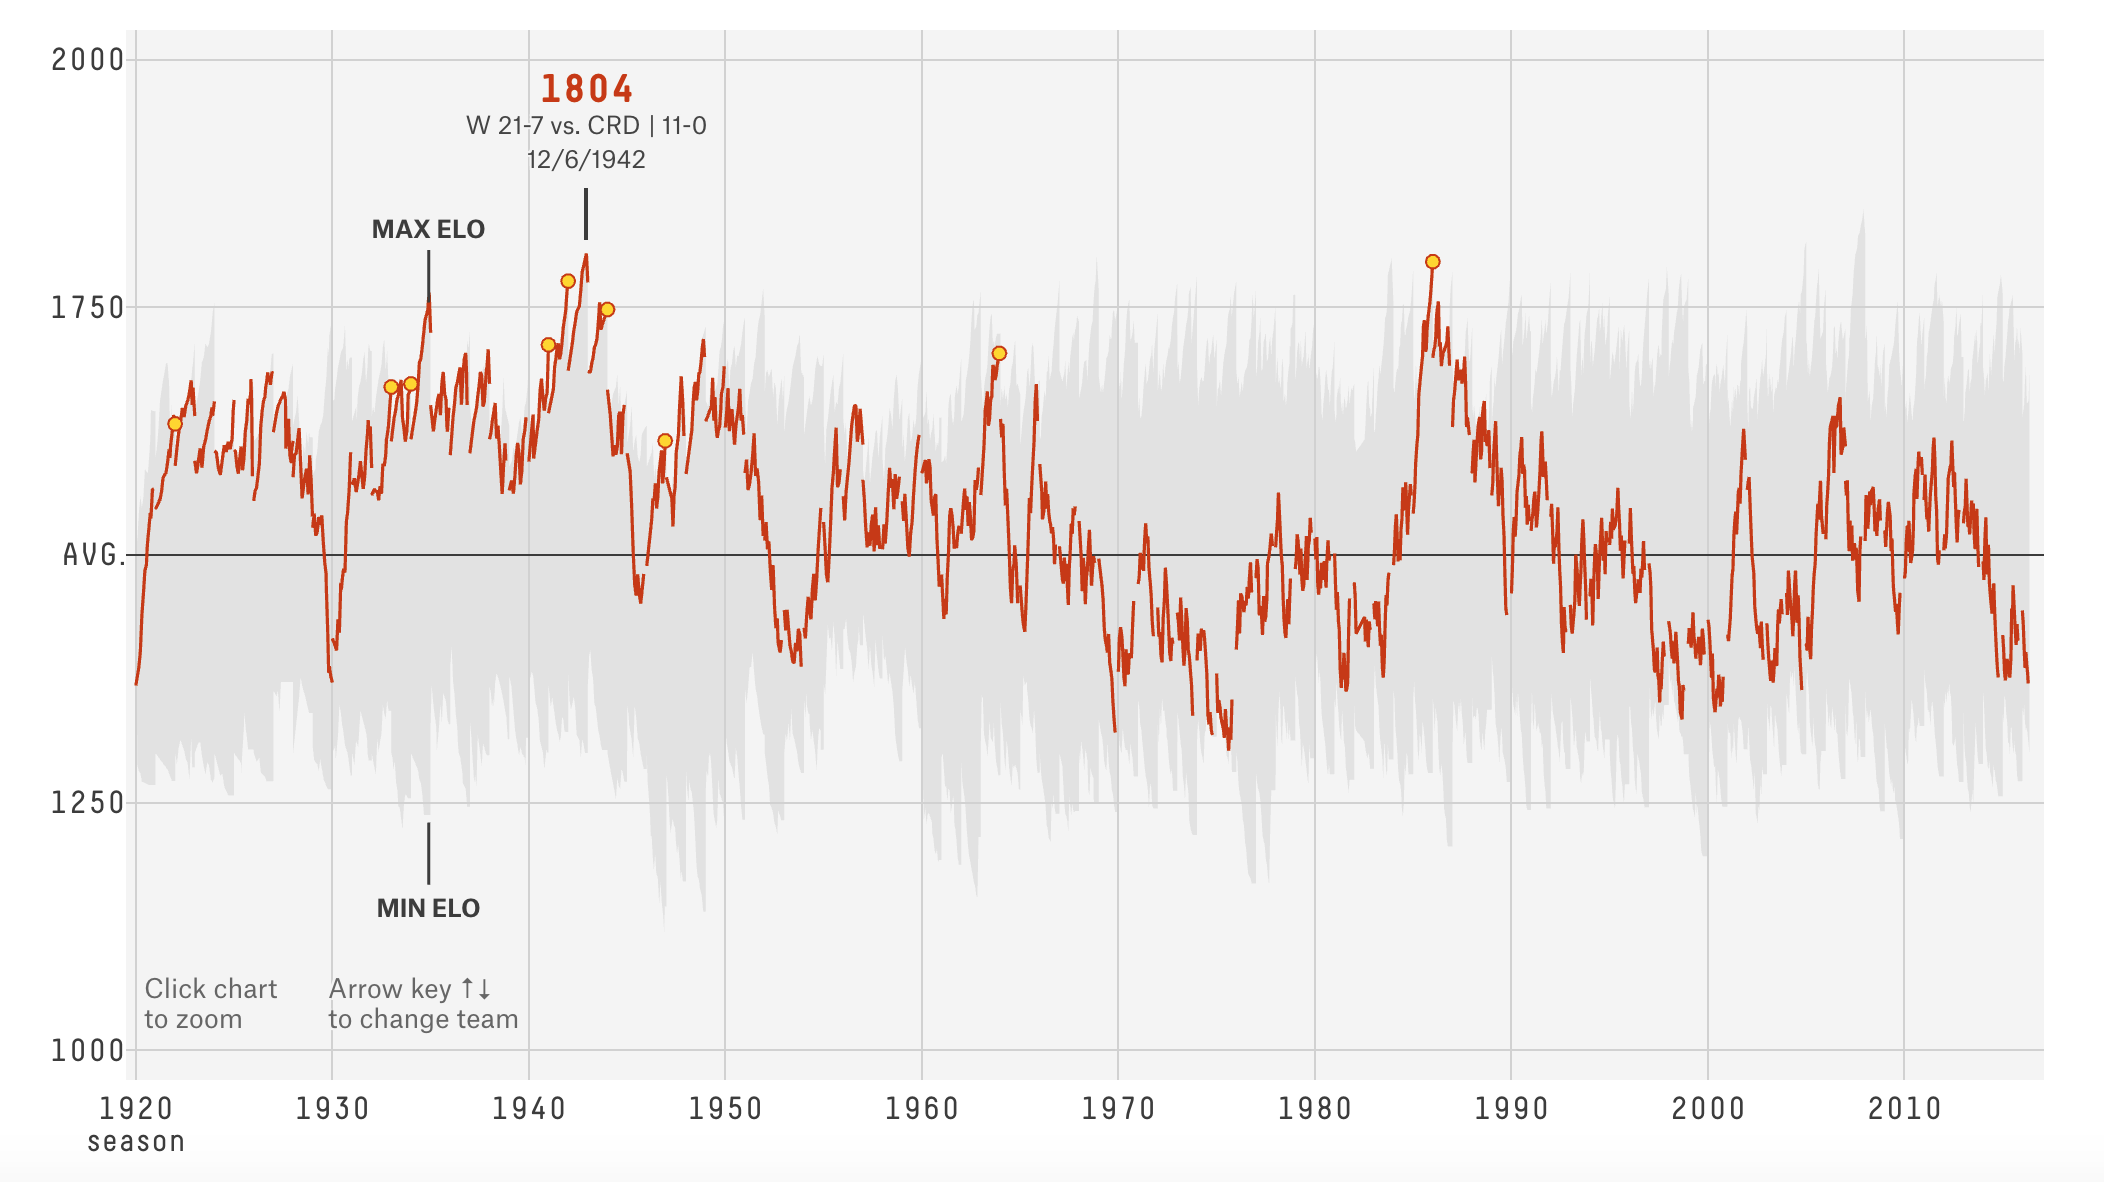
Sports fans are always debating which team is the greatest of all time. At FiveThirtyEight, an interactive data visualization examines the history of the National Football League using an Elo rating, which is a simple measure of strength based on game-by-game results. This allows viewers to quickly examine over 30,000 ratings and evaluate how each team has performed across decades of play.

This engaging data visualization contextualizes the ebb and flow of each NFL franchise. At a glance, viewers can compare how their team measured against the best in the league. By diving deeper into the data, the viewer can begin to examine why their team saw an increase or decrease in Elo. For example, in 1989 the Dallas Cowboys had the worst Elo rating, but three years later, they raised their rating by 500 points to reach the top. This can largely be attributed to the drafting of future Hall of Fame players Emmitt Smith and Darren Woodson. Ultimately, this simple visualization allows viewers to quickly analyze the complete history of the NFL, and better grasp the the impact players and coaches had on their franchises.

Oct 31, 2016 jennpal
Aortic StenosisInformation Graphic: What Time Will the Polls Close?
Recent Posts
  • Interactive Map: Sierra Nevadas
  • Data Visualization: Plotting Emotion
  • Information Graphic: What Time Will the Polls Close?
  • Data Visualization: The Complete History Of The NFL
  • Aortic Stenosis
Recent Comments
  • Mr WordPress on Hello world!
Archives
  • April 2017
  • January 2017
  • November 2016
  • October 2016
  • September 2016
  • March 2016
  • May 2015
Categories
  • Charts
  • Data visualization
  • Data Visualization
  • Diagrams
  • Examples
  • Exercises & Resources
  • Expert Interviews
  • Featured
  • GIS
  • Illustration
  • Interactive Graphics
  • JavaScript
  • Maps
  • Motion Graphics
  • Motion graphics
  • Tutorials
  • Uncategorized
Meta
  • Log in
  • Entries feed
  • Comments feed
  • WordPress.org
Footer Sidebar 1

Drop a widget on "Footer Sidebar 1" sidebar at Appearance > Widgets page.

Footer Sidebar 2

Drop a widget on "Footer Sidebar 2" sidebar at Appearance > Widgets page.

Footer Sidebar 3

Drop a widget on "Footer Sidebar 3" sidebar at Appearance > Widgets page.

2016
Planer theme by Dankov