Planer

  • Home
  • Chapters
    • 01: Introduction
    • 02: Visual Ethics
    • 03: Research
    • 04: Design
    • 05: Visualization
    • 06: Maps
    • 07: Diagrams
    • 08: Motion
    • 09: Case Studies
  • Examples
    • Maps
    • Charts
    • Diagrams
    • Data Visualization
    • Interactive Graphics
    • Motion Graphics
  • Resources & Exercises
  • Expert Interviews
  • Tutorials
    • Illustration
    • Motion graphics
    • Data visualization
    • GIS
    • JavaScript
Home 2016 November 08 Information Graphic: What Time Will the Polls Close?

Information Graphic: What Time Will the Polls Close?

screenshot-2016-11-08-11-08-47

Tuesday November 8th is election day, and polls begin closing across the county at 6 p.m. Eastern time in parts of Indiana and Kentucky. However, voting across the county concludes at 1 a.m. Eastern time on the western islands of Alaska.

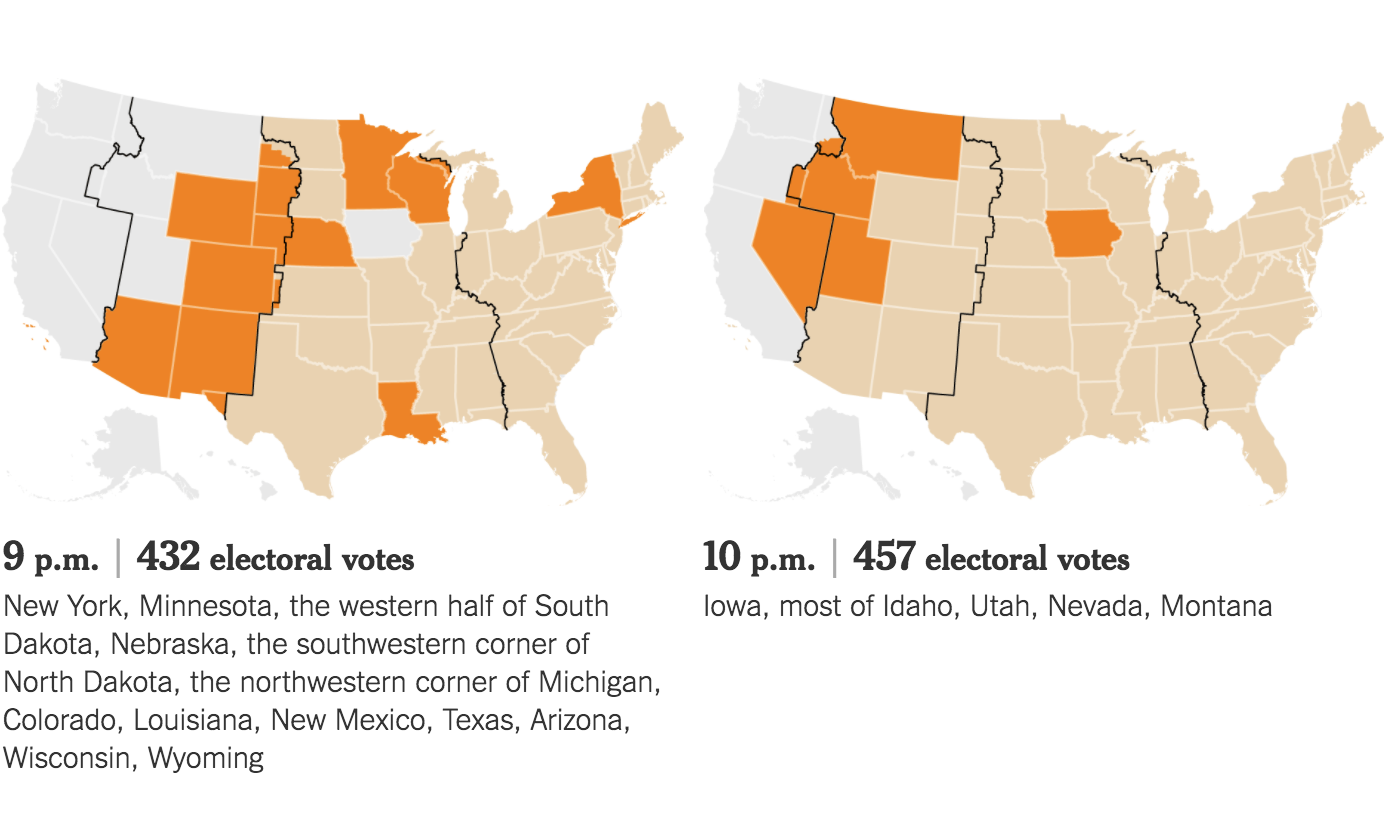
The New York Times, created a simple yet effective graphic that maps when polls close in each state, and how many electoral votes are at stake and showing each candidate’s path to the required 270 electoral votes. This information graphic logically unpacks information in several easy-to-understand maps and charts helping readers better understand the election process and at what point a winner may be determined. Area charts display the total electoral votes from the states expected to vote Democrat or Republican, and the electoral votes from contested states.

This allows the reader to understand what it would take for each candidate can win, and at what time a winner may be declared. For example, if Hillary Clinton secures all of the contested states, she will have enough electoral votes to win the election by 9:00 p.m. This information graphic is a clear demonstration that simple visualizations, can help readers better understand complex systems.

Nov 8, 2016 jennpal
Data Visualization: The Complete History Of The NFLData Visualization: Plotting Emotion
Recent Posts
  • Interactive Map: Sierra Nevadas
  • Data Visualization: Plotting Emotion
  • Information Graphic: What Time Will the Polls Close?
  • Data Visualization: The Complete History Of The NFL
  • Aortic Stenosis
Recent Comments
  • Mr WordPress on Hello world!
Archives
  • April 2017
  • January 2017
  • November 2016
  • October 2016
  • September 2016
  • March 2016
  • May 2015
Categories
  • Charts
  • Data visualization
  • Data Visualization
  • Diagrams
  • Examples
  • Exercises & Resources
  • Expert Interviews
  • Featured
  • GIS
  • Illustration
  • Interactive Graphics
  • JavaScript
  • Maps
  • Motion Graphics
  • Motion graphics
  • Tutorials
  • Uncategorized
Meta
  • Log in
  • Entries feed
  • Comments feed
  • WordPress.org
Footer Sidebar 1

Drop a widget on "Footer Sidebar 1" sidebar at Appearance > Widgets page.

Footer Sidebar 2

Drop a widget on "Footer Sidebar 2" sidebar at Appearance > Widgets page.

Footer Sidebar 3

Drop a widget on "Footer Sidebar 3" sidebar at Appearance > Widgets page.

2016
Planer theme by Dankov