Planer

  • Home
  • Chapters
    • 01: Introduction
    • 02: Visual Ethics
    • 03: Research
    • 04: Design
    • 05: Visualization
    • 06: Maps
    • 07: Diagrams
    • 08: Motion
    • 09: Case Studies
  • Examples
    • Maps
    • Charts
    • Diagrams
    • Data Visualization
    • Interactive Graphics
    • Motion Graphics
  • Resources & Exercises
  • Expert Interviews
  • Tutorials
    • Illustration
    • Motion graphics
    • Data visualization
    • GIS
    • JavaScript
Home 2016 March 19 Esri Story Maps

Esri Story Maps

StoryMap

GIS software includes a broad range of applications for combining digital maps and geo-referenced data, and the list of continues to grow. Although there are a vast number and type of GIS support tools out there, ArcGIS is the one most commonly used by journalists. ArcGIS includes an integrated collection of software products used for creating maps, compiling geographic data, analyzing mapped information, sharing and discovering geographic information, and managing geographic information in a database.

The Esri Story Map application provides templates for combining maps with narrative text, images, and multimedia content to easily harness the power of maps and geography to tell your story. And the best part is that Story Maps is an open source tool that doesn’t require you to know any coding to create rich, interactive data maps. As part of Esri’s ArcGIS, Story Maps lets users tap into the full power of the world’s leading mapping and GIS tool to create and manage maps made in the online or desktop interfaces.

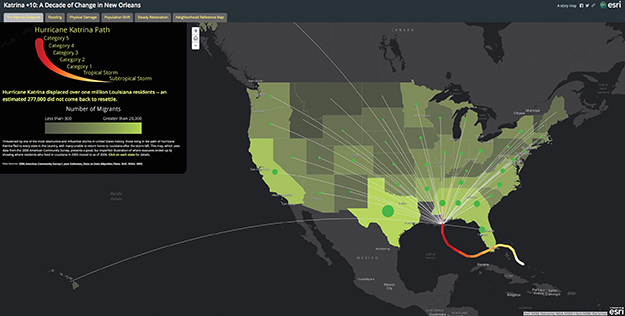
This interactive Story Map illustrates where evacuees ended up by showing where residents who lived in Louisiana in 2005 moved as of 2006. Additional tabs map flooding patterns, physical damage, population shifts, and restoration efforts. The map pulls in data from the 2006 American Community Survey 1-year Estimates, State-to-State Migration Flows, National Hurricane Center, National Oceanic and Atmospheric Administration, and the National Weather Service.

Click here to view the complete Hurricane Katrina Story Map.

Mar 19, 2016 jennpal
NYT Interactive President MapNYT Electoral Map
Recent Posts
  • Interactive Map: Sierra Nevadas
  • Data Visualization: Plotting Emotion
  • Information Graphic: What Time Will the Polls Close?
  • Data Visualization: The Complete History Of The NFL
  • Aortic Stenosis
Recent Comments
  • Mr WordPress on Hello world!
Archives
  • April 2017
  • January 2017
  • November 2016
  • October 2016
  • September 2016
  • March 2016
  • May 2015
Categories
  • Charts
  • Data visualization
  • Data Visualization
  • Diagrams
  • Examples
  • Exercises & Resources
  • Expert Interviews
  • Featured
  • GIS
  • Illustration
  • Interactive Graphics
  • JavaScript
  • Maps
  • Motion Graphics
  • Motion graphics
  • Tutorials
  • Uncategorized
Meta
  • Log in
  • Entries feed
  • Comments feed
  • WordPress.org
Footer Sidebar 1

Drop a widget on "Footer Sidebar 1" sidebar at Appearance > Widgets page.

Footer Sidebar 2

Drop a widget on "Footer Sidebar 2" sidebar at Appearance > Widgets page.

Footer Sidebar 3

Drop a widget on "Footer Sidebar 3" sidebar at Appearance > Widgets page.

2016
Planer theme by Dankov